Data Analysis
This page highlights how I approach data as a core component of the curriculum design process. Rather than using data solely to evaluate student performance, I analyze it to assess the effectiveness of instructional materials, identify patterns in student thinking, and iteratively refine learning experiences to better support mastery.
This approach reflects a structured system in which data collection, analysis, and instructional response are intentionally aligned.
Case Study: Data Representation & Analysis Unit (Grade 5)
Context:
I designed and implemented a multi-phase assessment system aligned to TEKS 5.9A–C, incorporating formative, reflective, and summative components to evaluate both conceptual understanding and application of data analysis skills.
The summative assessment required students to collect, represent, and analyze their own data through multiple graph types, emphasizing both procedural fluency and higher-order reasoning.
Data Analysis & Key Insights:
Analysis of assessment data revealed variation in mastery across standards.
- Strong overall performance in data representation (TEKS 5.9A)
- Moderate performance in problem solving with data (TEKS 5.9C)
- Lower relative performance in scatter plot representation and interpretation (TEKS 5.9B)
Error pattern analysis showed that student misconceptions were not primarily procedural. Instead, students struggled with:
- Interpreting relationships between variables
- Understanding how paired data represents real-world connections
- Explaining correlations conceptually
This indicated a gap in conceptual understanding, not just skill execution
Curriculum Design Insight:
These patterns suggested a misalignment in the instructional sequence. While students were able to construct graphs, the curriculum did not sufficiently scaffold the underlying concept of relationships between variables before introducing scatter plots.
This highlighted the need to:
- Strengthen prerequisite conceptual understanding
- More intentionally sequence skill progression
- Integrate interpretation earlier in the learning experience
Design Iteration:
In response to these insights, I refined the unit to improve alignment between content, instruction, and assessment.
Key adjustments included:
- Front-loading conceptual understanding of variable relationships before graph construction
- Incorporating scaffolded interpretation tasks prior to independent application
- Embedding targeted formative checks to identify misconceptions earlier
- Designing small-group supports aligned to specific error patterns
Outcome:
Following these adjustments, student performance improved in subsequent data interpretation tasks. Students demonstrated:
- Increased accuracy in identifying relationships between variables
- Stronger explanations of correlations
- Reduced reliance on procedural guessing
These results validated the importance of aligning instructional design with conceptual demands and reinforcing key ideas before increasing task complexity.
Reflection:
This process reinforced my approach to data as a tool for continuous iteration. By analyzing not just what students got wrong, but why, I am able to refine curriculum design, improve alignment, and create more effective learning experiences.
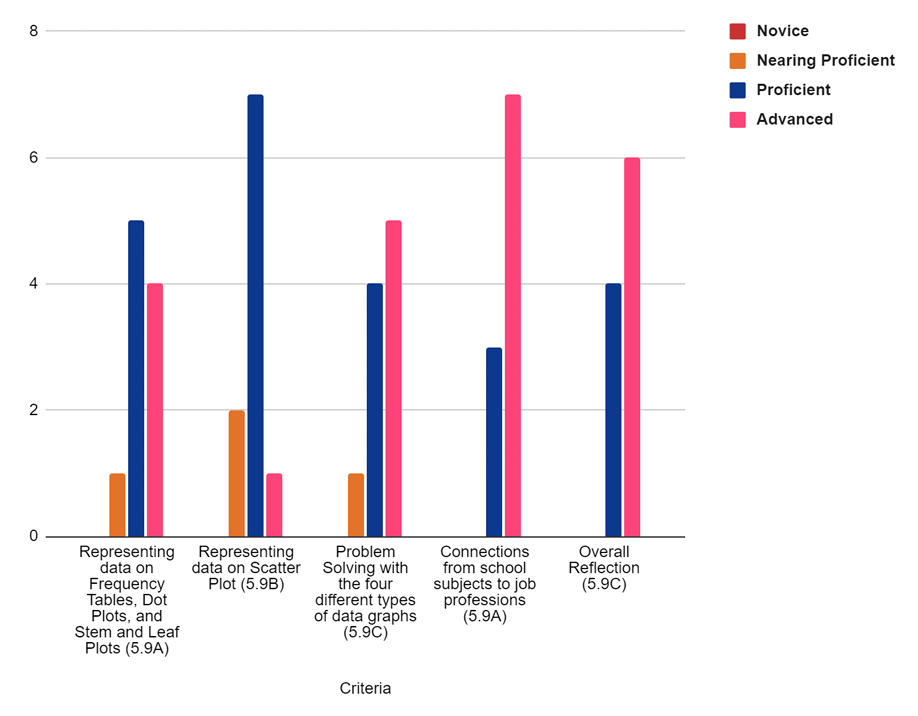
Standards-Based Mastery Distribution (TEKS 5.9A–C)
This visualization shows student performance across key standards within the data representation unit. While most students demonstrated proficiency in constructing and analyzing data (TEKS 5.9A & 5.9C), performance on scatter plot concepts (TEKS 5.9B) showed a higher concentration of students in the “Nearing Proficient” range. This pattern indicated a gap in conceptual understanding of relationships between variables rather than procedural skill.
This data served as a key decision point in refining the instructional sequence to better support conceptual understanding before introducing more complex representations.
Notably, performance trends suggested that students were able to execute graph construction tasks but struggled to transfer understanding to relational reasoning, highlighting a need for stronger conceptual scaffolding within the progression.
Student Data Tracking System
This student-facing data tracking system was designed to support transparency and ownership of learning by allowing students to monitor their performance across content areas over time. The tracker aligns performance levels to standardized proficiency bands, providing a clear visual representation of growth and progress toward mastery.
By engaging with their own data, students are able to identify trends in their performance, set goals, and reflect on their learning. This system also supports alignment between student self-monitoring and teacher-driven data analysis, creating a more cohesive and intentional approach to tracking progress across standards.
The visual structure of the tracker was intentionally designed to make performance data accessible and actionable for students, reinforcing clarity around expectations and progress.
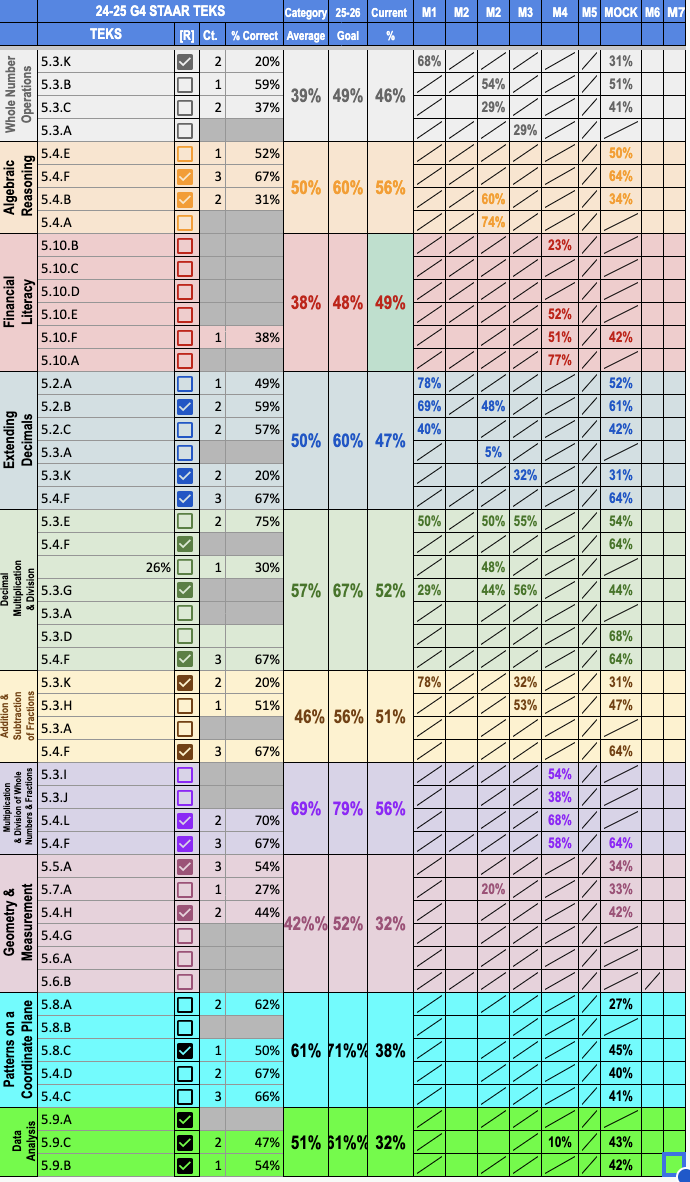
Data System: TEKS-Aligned Performance Tracker
This data tracking system was designed to analyze student performance at the standard level across multiple assessments. By organizing data by TEKS, this tool allows for targeted analysis of student understanding, identification of trends across assessments, and more precise instructional decision-making.
This system enables the identification of specific skill gaps, supports prioritization of standards, and informs targeted instructional adjustments.
For example, analysis of this data can reveal inconsistencies in student performance across related standards, highlighting areas where conceptual understanding may need to be strengthened.